Verifysoft Verybench - Graphical Add-on for Testwell CMT++ 5.0
Table of Contents
-
1 Requirements and Installation
-
2 Complexity Measurement
-
3 Graphical User Interface
-
4 Sub Views of Verybench
-
5 Quick Guide: Improving Source Code
-
6 Reports
-
7 Trouble Shooting
Make sure to meet the following requirements prior to installing Verybench 2.1.
1.1 Minimum Requirements
-
Microsoft Windows 7 (32bit/64bit)
-
Microsoft .NET Runtime Environment 4.0
-
Testwell CMT++ 5.0 licensed and installed on the same physical machine Verybench is running on.
-
Standard graphics card and screen dimensions of at least 1024x768.
1.2 Installing and Starting Verybench
Install Verybench by following these instructions. Make sure to closely follow them.
-
Obtain a copy of Verybench from Verifysoft Technology GmbH either on disc or by download via the link provided to you after the purchase.
-
In case you downloaded Verybench, unzip the downloaded folder to a desired location. Verybench is installed now.
-
Deinstall all versions of Testwell CMT++ (<= 5.0) from your machine.
-
Install the version of Testwell CMT++ 5.0 bundled with Verybench.
-
Install Microsoft's .NET Runtime Environment 4.0
-
Go to the folder where you unzipped the Verybench bundle to and start Verybench by executing "verybench.exe".
Working directory of Verybench is: C:\Users\%userprofile%\AppData\Verybench
Complexity measurement is a process of deriving indicators from the structure of source code that has been compiles is syntactically correct. These indicators then serve as judgment for this source code's quality. Obtaining indicators is accomplished by algorithms directly applied to either a source file (module) or functions within a source file. In General, these
algorithms are called (code) metrics. They make up a set of formulae that is provided by code metrics measurement tools such as Testwell CMT++.
2.1 Testwell CMT++
Testwell CMT++ was developed by the company Testwell (www.testwell.fi). The company is situated in Tampere Finland and is a spin-off of Nokia Group Finland. In the year 2013, all intellectual properties were transferred from Testwell Oy to Verifysoft Technology GmbH.
Formerly, the tool Testwell CMT++ was developed as command line tool aimed at measuring the complexity of source code written in C, C++ or assembly language often found in embedded projects at Nokia. Table 2.1.1 shows the metrics that are provided by Testwell CMT++ 5.0.
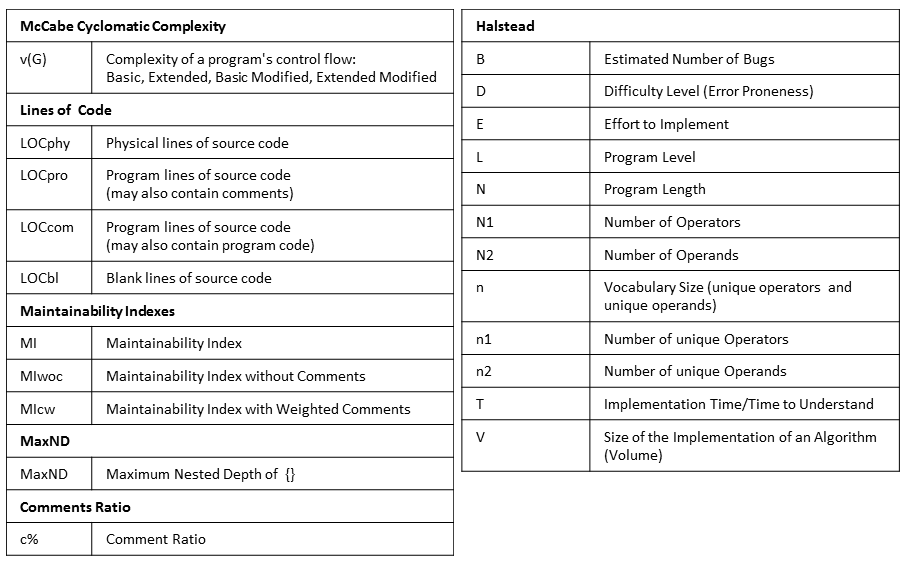
Tab. 2.1.1: Code metrics provided by Testwell CMT++ 5.0.
Although Testwell CMT++ 5.0 provides a number of metrics and settings when it comes to measuring source files, it still lacks:
-
Managing code complexity projects and snapshotting code quality over time.
-
A code raking system that tells the code quality to the user instantly.
-
Graphical aggregated overviews on:
-
All metrics values (in respective scopes)
-
All alarm limits (n respective scopes)
-
All distributions of metrics (in respective scopes)
-
Complexity relationships between metric values and source code.
-
Possibilities to select large amounts of source files comfortably and fully recursively in a standardized and intuitive UI.
-
Comfortable reporting in PDF/HTML/XML/CSV/TXT format.
2.2 Introducing Verybench
Verybench gives much quicker, more aggregated and more comprehensive overviews on a source code's quality situation than the former loosely linked reports available by Testwell CMT++. Figure 2.2.1 shows the original loosely linke HTML report by Testwell.
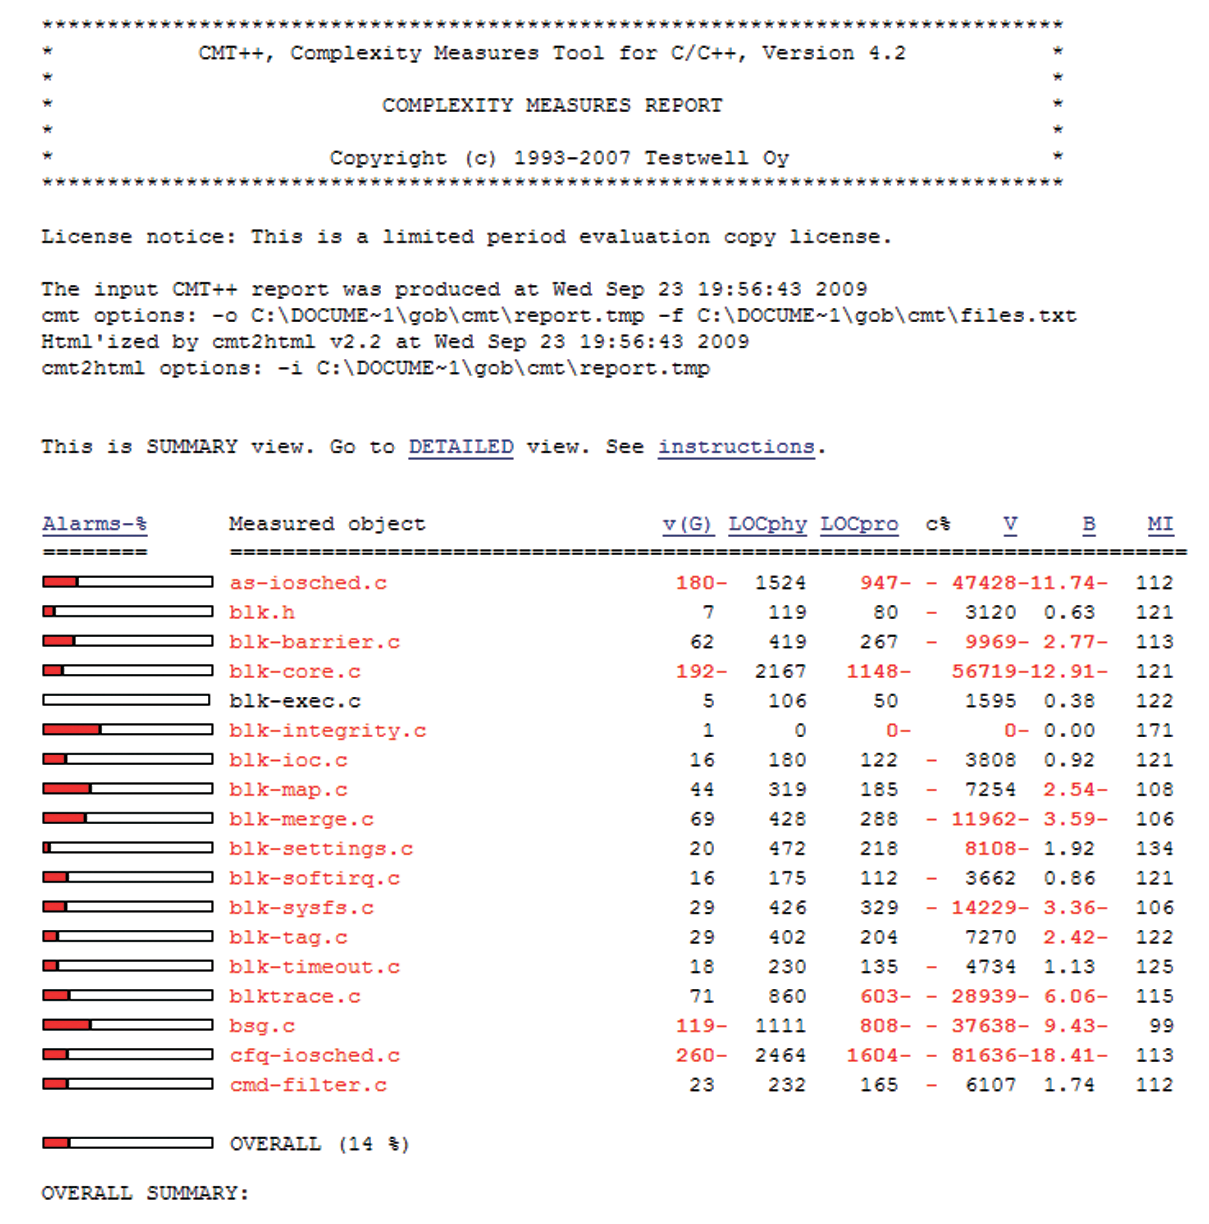
Fig. 2.2.1: Original loosely linked HTML report by Testwell.
Although Verybench is a pure graphical add-on for Testwell CMT++ 5.0, it still provides virtually all original functionalities of Testwell CMT++. Therefore, Verybench enables software developers as well as quality engineers and software testers to collaborate easier and earlier on inner quality of a (C/C++) software system during development. It accelerates the way code metrics and code quality are understood by an entire development team and not just by single individuals with special know-how.
A crucial step in understanding a source code's quality situation is to understand how it is going to be measured. Verybench has its own management semantics for complexity measurements. However, they are based on the ones stated by Testwell.
While Verybench focuses on managing software quality over time and delivering clarity of results, Testwell CMT++ concentrates merely on fast and correct measuring of source files.
Although the process of measuring source files is fully transparent to the user, certain aspects need to be kept in mind when working with Verybench.
2.3 Testwell and Verybench Semantics
First of all, semantics as they are used with Testwell are the same semantics as they are used with Verybench. In Verybench none of the original semantics were neglected or replaced; they only were extended.
Let's have a look at the original semantics of Testwell CMT++ and then go on with the extensions made by Verybench.
Testwell's Measuring Model: Scope Based Complexity
Testwell CMT++ strongly relies on scopes. The concept of a scope is that it confines interpretability (in this case; metric values) to a frame of reference so narrowly that every metric value resulted by a measurement needs only be regarded within the particular frame of reference (scope) it was measured in to actually be fully understandable.
What does this mean exactly?
Figure 2.3.1 shows three defined scopes that Testwell introduced to measure the quality of source code. These three scopes alone make up the entire measuring model with Testwell. The necessity for such a model should be obvious since not everyone thinks of the same structural elements and entities when it comes to measuring the quality of source code. Performing measurements in two different scopes is not only done to avoid misunderstandings when it comes to interpretation of metric values, it is also done to cope with the structure a software system inherently implies during development (a software system can be comprised of several files, one file can be comprised of several functions, one function can be comprised of several statements). Keep in mind the following key features about Testwell's scopes:
-
The three scopes are called System Scope, File Scope and Function Scope.
-
The Function Scope applies metrics to individual functions of a file and to those only.
-
The File Scope applies metrics to individual files and to those only. It is not based on the metrics values obtained by Function Scope.
-
The System Scope aggregates all metrics obtained from File Scope or Function Scope.
-
File Scope and Function Scope are measured totally independently from each other although they seem to be hierarchical. With Testwell CMT++/Verybench you are able to measure all three scopes at once by default. Feel free to concentrate only on the one that interests you the most. Considering figure 2.3.1, now it becomes clear that measuring source files in different scopes makes perfect sense to an engineer who wants to granularly examine his source code's quality.
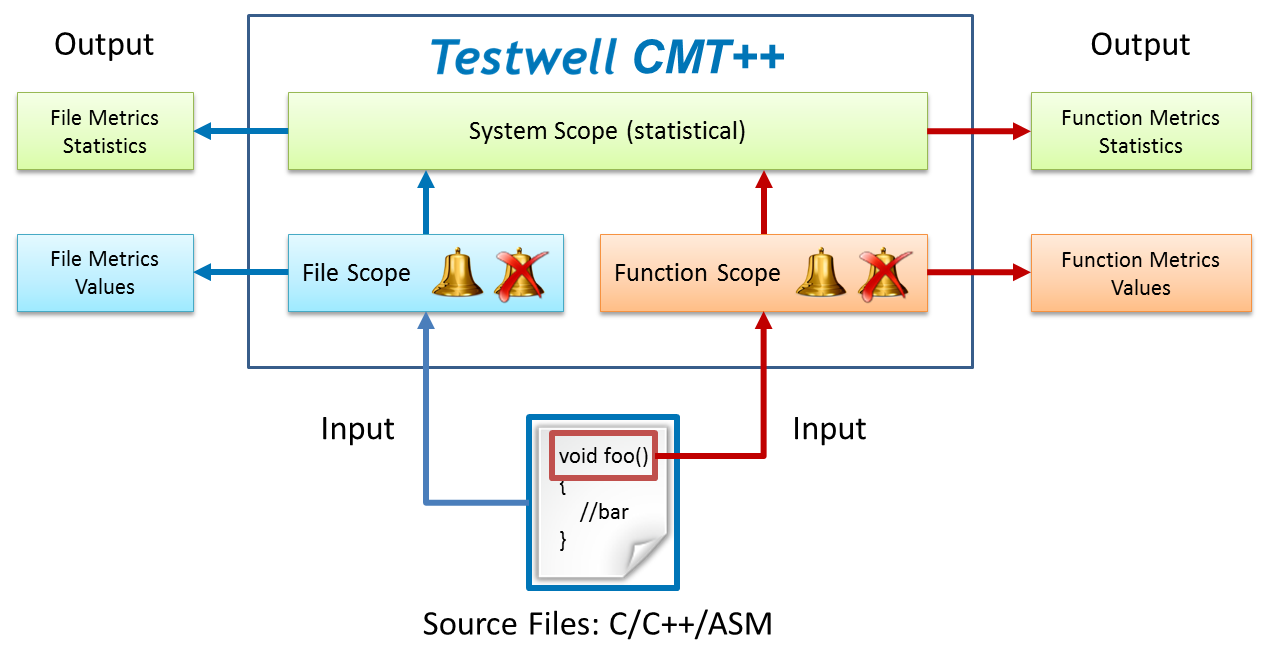
Fig. 2.3.1: Testwell's measuring model based on three scopes.
Testwell's Evaluation Model: Alarming and Non-Alarming Code Metrics
Over the years of developing, Testwell also introduced alarm limits for almost all of the three scopes and for the most important code metrics. These alarm limits enable the user to define when a metric value goes “critical” (in fact is too high or too low) in a code measurement. Alarm limits can have a lower and an upper bound or only a lower bound and can be set for each code metric individually (if provided). Tweaking alarm limits for all provided code metrics can be a time consuming task. Additionally, the tweaked values should also be kept static over time (not to measure with two different yard sticks over time). Therefore, Testwell simply recommends using default alarm limits for all code metrics which are called Recommended or Default Alarm Limits. They can be used out of the box and do not need to be tweaked to deliver good quality judgments on source code. But, as said before, there is always the possibility to manually set and tweak alarm limits where provided. To get an overview of which metric has or has no alarm limits in which scope, table 3.3.2 shows all combinations provided by Testwell.
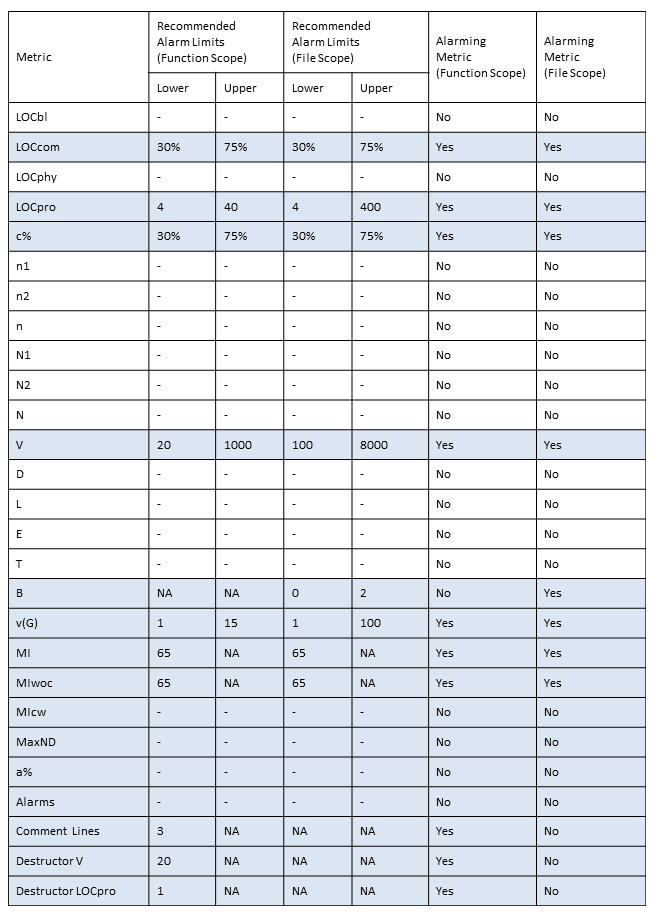
Tab. 2.3.2: Overview over all code metrics, scopes, alarming types and default alarm limits.
Moreover, to understand why some code metrics trigger alarms although their metric values should not trigger any alarm at all, one has to keep in mind that almost all metric values are rounded. So don't be too harsh on the precision of the metric values themselves - instead regard the alarm limit system more as an indicator system for a code's quality and focus more on getting no alarms at all. Verybench supports the configuration of all provided alarm limits conveniently via the Project Editor. Fig. 2.3.3 and fig. 2.3.4 show the dialogs and all options for alarm limits in Function Scope and File Scope.
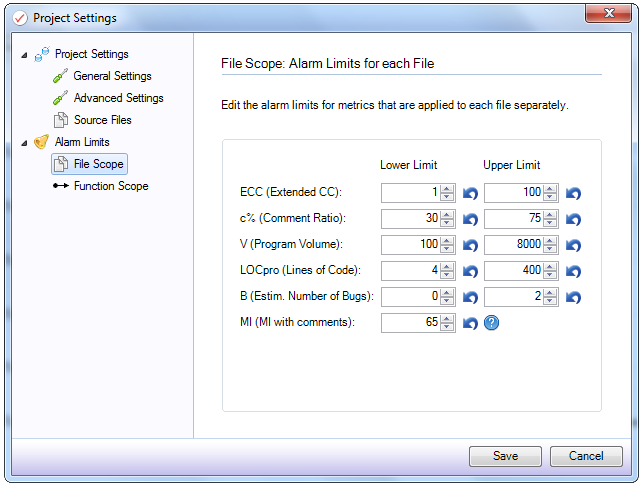
Fig. 2.3.3: Alarm limits for code metrics applied to File Scope.

Fig. 2.3.4: Alarm limits for code metrics applied to Function Scope.
Now, there are some peculiarities as you might have already noticed from table 2.3.2 which cause confusion among users (all the 'No's in the right columns). These peculiarities are crucial to understand and are rather caused by incremental design over the past 20 years at Testwell than by intention. Testwell CMT++ defines alarm limits for the scopes; File Scope
and Function Scope, however Testwell does not define alarm limits for System Scope as figure 2.3.1 clearly shows (missing alarm bell icons in the System Scope box). There are no alarm limits for System Scope at all. The System Scope has only statistical meaning and only aggregates and averages the metric values obtained from File Scope or Function Scope.
What does that all mean for measuring a source code's quality?
This means that System Scope has neither alarming metrics nor non-alarming metrics due to a lack of available alarm limits by Testwell's design. However, File Scope and Function Scope do have alarm limits on several (not all) metrics, as indicated with the uncrossed and crossed bell icons. The uncrossed alarm bell icons indicate that there are metrics in this scope that do have alarm limits. These metrics are called Alarming Metrics because they produce an alarm when they deviate with their metrics values from their predefined lower or upper bounds. The crossed versions of the alarm bell icons indicate that this scope also has metrics that do not produce any alarm. Those metrics are called Non-Alarming Metrics and just have informative character. If you also want to define alarm limits for those metrics, you cannot do this within Verybench. You have to do it by manually defining your own alarm lim- its in an external application like e.g. in MS Excel and calculate deviation also manually. Keep in mind that if you want to do this, this process can be simplified by using the .CSV report functionality of Verybench. A generated .CSV report can then easily be imported into MS Excel and evaluated via a Visual Basic script.
Verybench: Projects and Snapshots
To manage all metrics values and keep track of source code quality over time, Verybench offers a unique concept: Snapshots. Snapshotting states over time to keep track of state changes, is a rather old concept but is has never been applied to code metrics before.
Let's take a look at a Snapshot. A snapshot is a part of a project. It solely serves as a data container to hold all measured source files and their archived metrics values in place. In fact, several snapshots are supposed to be created over time. So a project serves as a container for snapshots. Every time the user feels right to snapshot the current quality state (metric values) of an observed set of source files, he can create a snapshot which automatically performs a measurement and captures all latest metrics values. Multiple snapshot taken over time, each conserving the latest quality state (metrics values) of the observed set of source files at a certain point in time, automatically forms a Quality Baseline showing the code quality trend the project is facing. However, before you start forming a Quality Baseline by snapshotting your source code's quality over a long period of time, you should make sure to have fully understood the next three basic rules of snapshotting with Verybench.
-
You should not create snapshots larger than 200 source files in total (due to high computational load and rather long measuring times).
-
You should not always work with a single snapshot. Working with a single snapshot undermines the concept of baselining quality trends. It also leads to unclarity about what code quality was archived when.
-
You should not vary the basic size of your set of source files much since mere adding or removing of single source files can automatically increase or decrease your entire quality trend although none of your source files changed in the first place. This leads to false assumptions about the actual code quality.
Keep in mind that is does not matter if you vary the size of your observed set of source files for the baseline mechanism to work; it is just no good practice.
Moreover, you can edit your Latest Snapshot (latest snapshot in time), add new snapshots or remove snapshots from any project at any time you want during your code quality examination. Figure 2.3.5 shows the semantics of snapshotting code quality state multiple times over time.
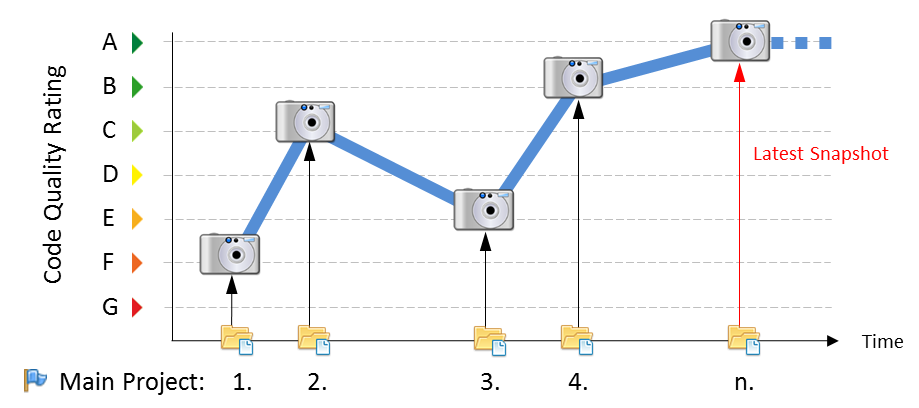
Fig. 2.3.5: Code quality baseline formed by snapshotting metric values continuously over time.
Let's take a closer look at the graphical user interface of Verybench. The graphical user interface is divided into four main areas. These four main areas are dedicated to accomplish different tasks each. Figure 3.1 shows these four main areas.
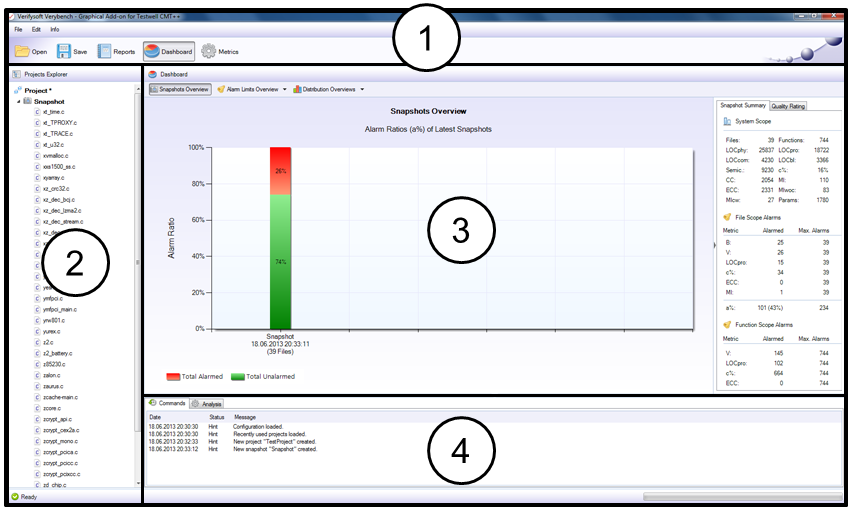
Fig. 3.1: The four main graphical areas of Verybench.
-
The Main Menu and the Quick Menu.
-
The Projects Explore to manage projects, snapshot and source files.
-
The View Area for the two main sub views Dashboard View and Metrics View.
-
The Command Log and the Analysis Log.
3.1 Menus of Verybench
3.1.1 Main Menu

Fig. 3.1.1: Main menu of Verybench.
-
1. File Menu Options:
-
Go to File, click New > Project to create a new project to manage snapshots or press Ctrl + N.
-
Go to File, click New > Snapshot to create a new snapshot to manage source files or press Ctrl + Alt + N.
-
Go to File, click New > Report to create an XML, HTML, PDF, CSV or Text report of the latest snapshot (bold) of the current main project. A dialog will show up enabling you to set further options to customize the report type you choose.
-
Go to File, click Open... to open an existing project from disc.
-
Go to File, click Recently Used and select a recently used project from the list of 10 recently used (opened/saved) projects to open it from disc.
-
Go to File, click Save to save the current main project to the project location you provided when you created the project or press Ctrl + S.
-
Go to File, click Save As to save the current main project to a desired location on disc.
-
Go to File, click Quit to exit Verybench or press Alt + F4.
-
2. Edit Menu Options:
-
Go to Edit, click Settings to set up syntax coloring or how many snapshots should be saved in a project (to reduce the size of a project file).
-
3. Info Menu Options:
-
Go to Info, click About to view information about the application and its version.
-
Go to Info, click Online Help to view this online help or press F1.
3.1.2 Quick Menu
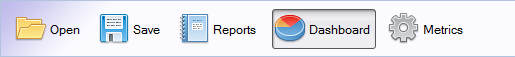
-
Opens an existing project from disc.
-
Saves the current project to predefined project location.
-
Opens the Reports Editor to set up a report of desired type.
-
Switches to Dashboard View to view snapshots, alarm limits or distributions overviews.
-
Switches to Metrics View to examine metrics values in File Scope and Function Scope.
3.2 Projects Explorer
3.2.1 Viewing Contents of Items
The Projects Explorer together with the View Area is the most important part of the entire graphical user interface of Verybench. It provides the possibilities to manage and manipulate snapshot and source files. Figure 3.2.1.1 demonstrates how the VProjects Explorer works and how it behaves for different node types. Regarding figure 3.2.1.1, if the user left clicks a snapshot, Verybench switches to Metrics View automatically and the metric values that were archived in File Scope for the selected snapshot can be viewed in the View Area. This can be done with any snapshot not just the latest.
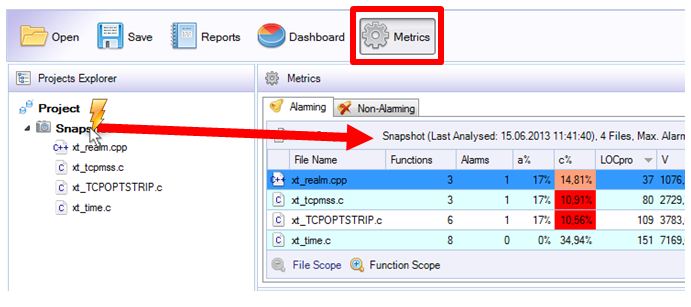
Fig. 3.2.1.1: Left-clicking a snapshot node shows its metrics values that were archived in File Scope.
Regarding figure 3.2.1.2, if the user left clicks a source file, Verybench switches to Metrics View automatically and the metric values that were archived in Function Scope for the selected source file can be viewed in the View Area. This can be done with any source file of any snapshot.
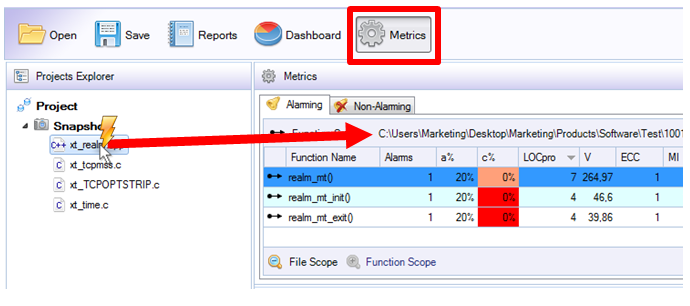
Fig. 3.2.1.2: Left-clicking a source file node shows its metrics values that were archived in Function Scope.
3.2.2 Context Options on Items
Regarding figure 3.2.2.1, if the user right clicks a project he is able to perform the following operations:
-
Create a new snapshot for the selected project to capture code quality.
-
Set the selected project as main project which means that all future measurements are performed solely on this project.
-
Rename the selected project by a desired name or press F2.
-
Edit the setting of the selected project.
-
Close the selected project which means it is no longer viewable and must be reopened in order to be viewed again.
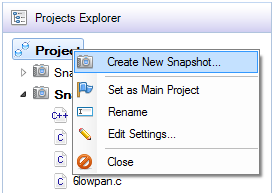
Fig. 3.2.2.1: Right-clicking a project offers several operations.
Regarding figure 3.2.2.2, if the user right clicks a snapshot he is able to perform the following operations:
-
Rename the selected snapshot by a desired name or press F2.
-
Remove the selected snapshot from the parent project. When removing a snapshot the following rules are applied depending on if the snapshot to be removed is currently the latest snapshot at the time of removal:
-
If it is the latest snapshot, it is replace by the snapshot that was taken right before it. If there is no other snapshot the project is empty afterwards.
-
If it is not the latest snapshot, the latest snapshot is not replaced because it was never removed in the first place and it stays the same whereas the snapshot to be removed is actually removed as expected.
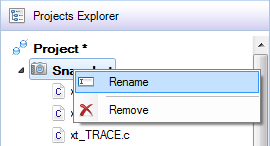
Fig. 3.2.2.2: Right-clicking a snapshot offers the two operations: Rename and Remove.
Regarding figure 3.2.2.3, if the user right clicks a source file he is able to perform the following operation:
Remove the selected source file form the parent snapshot. Keep in mind that all source files of a snapshot can be removed except one. One source file needs to be present at all times since Verybench does not allow empty snapshots. Also source files of snapshots older than the latest snapshot cannot be removed since older snapshots cannot be remeasured.
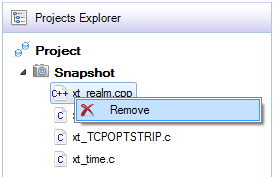
Fig. 3.2.2.3: Right-clicking a source file offers to remove it from the parent snapshot.
3.3 Views of Verybench
3.3.1 Dashboard View
Regarding figure 3.3.1.1, if the user switches to Dashboard View the current Snapshots Overview of the project or the current Alarm Limits Overviews or the current Distributions Overview of the latest snapshot (and only the latest snapshot) can be viewed in the View Area.
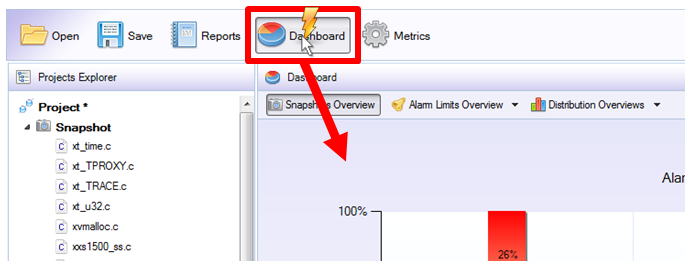
Fig. 3.3.1.1: Clicking the Dashboard button enables the user to receive additional info about the latest snapshot.
3.3.2 Metrics View
Regarding figure 3.3.2.1, if the user switches to Dashboard View the current Snapshots Overview of the project or the current Alarm Limits Overviews or the current Distributions Overview of the latest snapshot (and only the latest snapshot) can be viewed in the View Area.
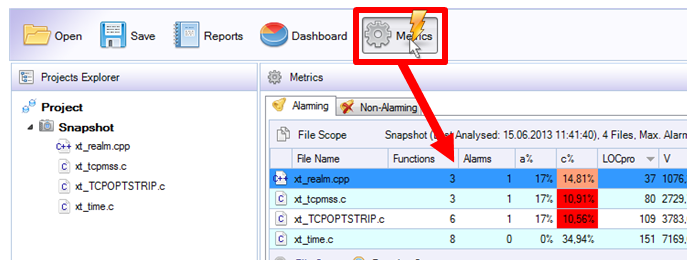
Fig. 3.3.2.1: Clicking the Metrics button enables the user to receive the metrics values of the latest snapshot.
3.4 Command and Analysis Log
The Command Log logs all operations of Verybench whereas the Analysis Log logs all operations of Testwell CMT++ related to measuring source files. Both logs list their messages chronologically according to their date of occurrence. So if you are curious about what Verybench or Testwell CMT++ is doing or just want to know what went wrong in case of an analysis failure, be sure you take a look at these logs.
Keep in mind that you can save the Analysis Log to a .TXT file any time you want for further study.
4.1 Snapshots Overview
The Dashboard View gives the user the most comprehensive and most appealing overview on Testwell metrics. The Dashboard View has 12 sub views built in that show different aspects and relations of metrics values graphically. Each of these sub views provides access to different aspects of measurement results, statistics on results or relationships between results. An overview over the last 6 snapshots of the current main project that form the Quality Baseline based on ratios of all alarmed and unalarmed code metrics for each of the 6 snapshots. Figure 4.1.1 shows this sub view.
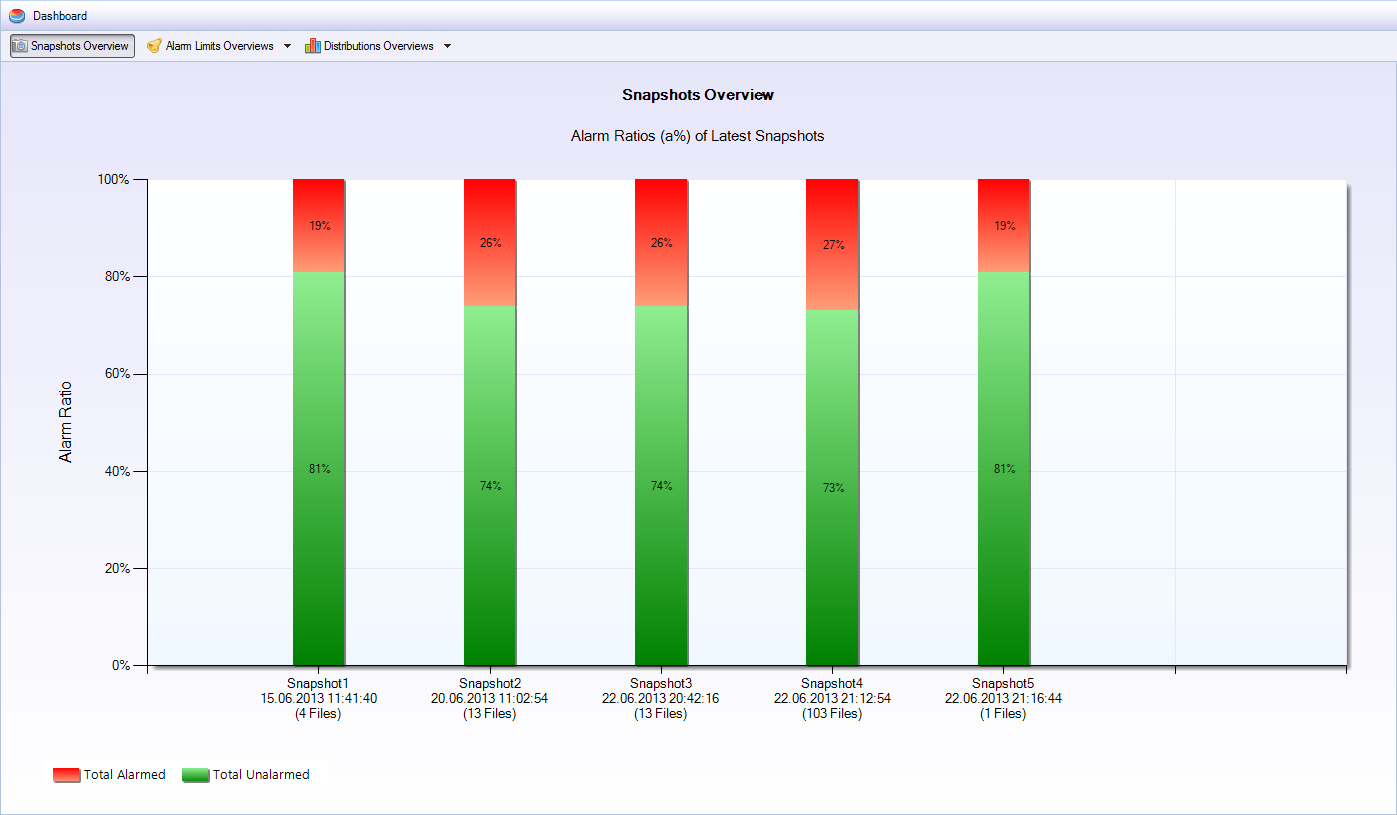
Fig. 4.1.1: Snapshots Overview with alarm ratios of the latest 6 snapshots of a project.
4.2 Latest Snapshot Overview
Figure 4.2.1 shows the Latest Snapshot Overview with the current code metric values of the latest snapshot in System Scope and its current alarms in Function Scope and File Scope.
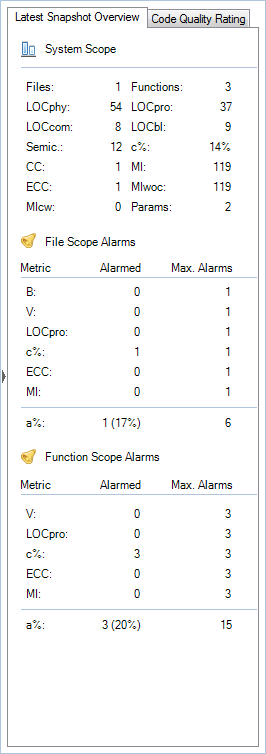
Fig. 4.2.1: Latest Snapshot Overview on the right hand side of the Snapshots Overview chart (left tab).
4.3 Code Quality Rating
The Code Quality Rating (CQR) shows the current code quality of the latest snapshot based on the total number of alarms in File Scope and Function Scope. The rating is based on the maximum alarms that can be archived in both scopes within the latest snapshot. Keep in mind that a source code worse in quality than level C is considered bad code. Figure 4.3.1 shows the Code Quality Rating.
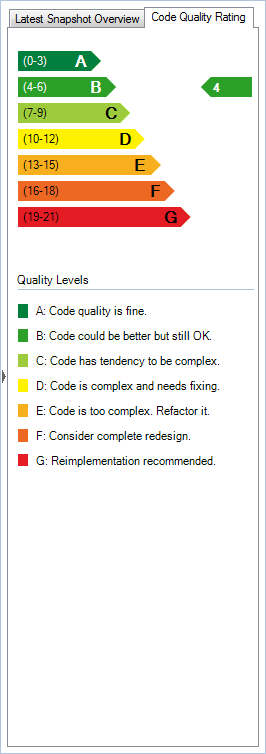
Fig. 4.3.1: Code Quality Rating on the right hand side of the Snapshots Overview chart (right tab).
4.4 Alarm Limits Overviews
The Alarm Limits Overviews are statistical sub views and show all configured alarm limits and all averaged values of a metric in a radar chart for System Scope and File Scope respectively. Alarm limits for each metric can therefore be examined individually in respect to these two scopes and one averaged value per metric. Fig. 4.4.1 shows the alarm limits overview in System Scope to demonstrate the principle of the radar chart. The averaged metric value for the metric V in System Scope is calculated (exemplarily) as follows.
V_AVG = Sum(V_file_1...V_file_i) / Number of Files Measured
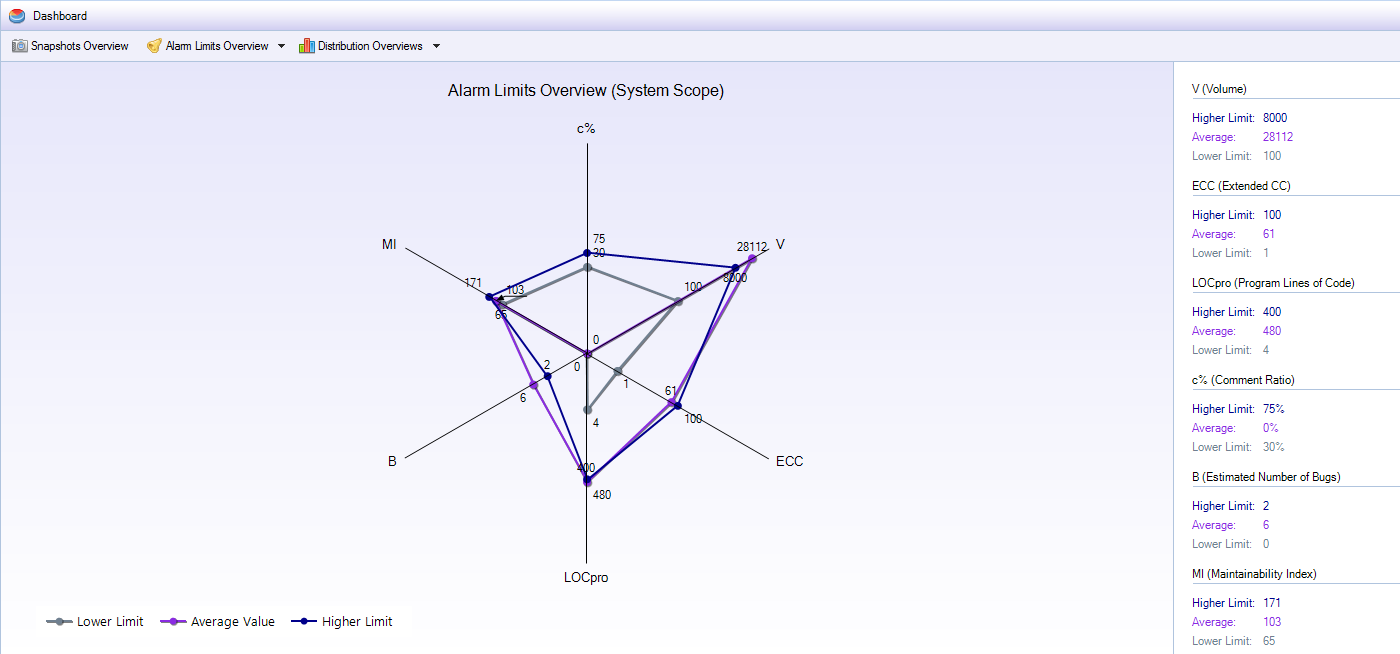
Fig. 4.4.1: Alarm Limits Overview with all lower and higher alarm limits and averaged numbers of alarms in System Scope per metric.
4.5 Distributions Overviews
The File Distribution and Function Distribution sub views basically are histograms that show how many files or functions distribute on metrics values. Fig. 4.5.1 shows the Distribution Overview for Files (System Scope) for the metric V.
-
If all files or functions are off alarm limits (in fact are above higher alarm limits or be low lower alarm limits), the bar is marked red.
-
If all files or functions are within alarm limits within an X-axis interval, the bar is marked green.
-
If some files or functions are within alarm limits and some are not within an X-axis interval, the bar is marked yellow.
File distributions can be examined for:
-
V (Program Volume)
-
c% (Comment Ratio)
-
LOCpro (Program Lines of Code)
-
v(G) (McCabe Cyclomatic Complexity)
-
B (Estimated Number of Bugs)
Function distributions can be examined for:
-
V (Program Volume)
-
c% (Comment Ratio)
-
LOCpro (Program Lines of Code)
-
v(G) (McCabe Cyclomatic Complexity)
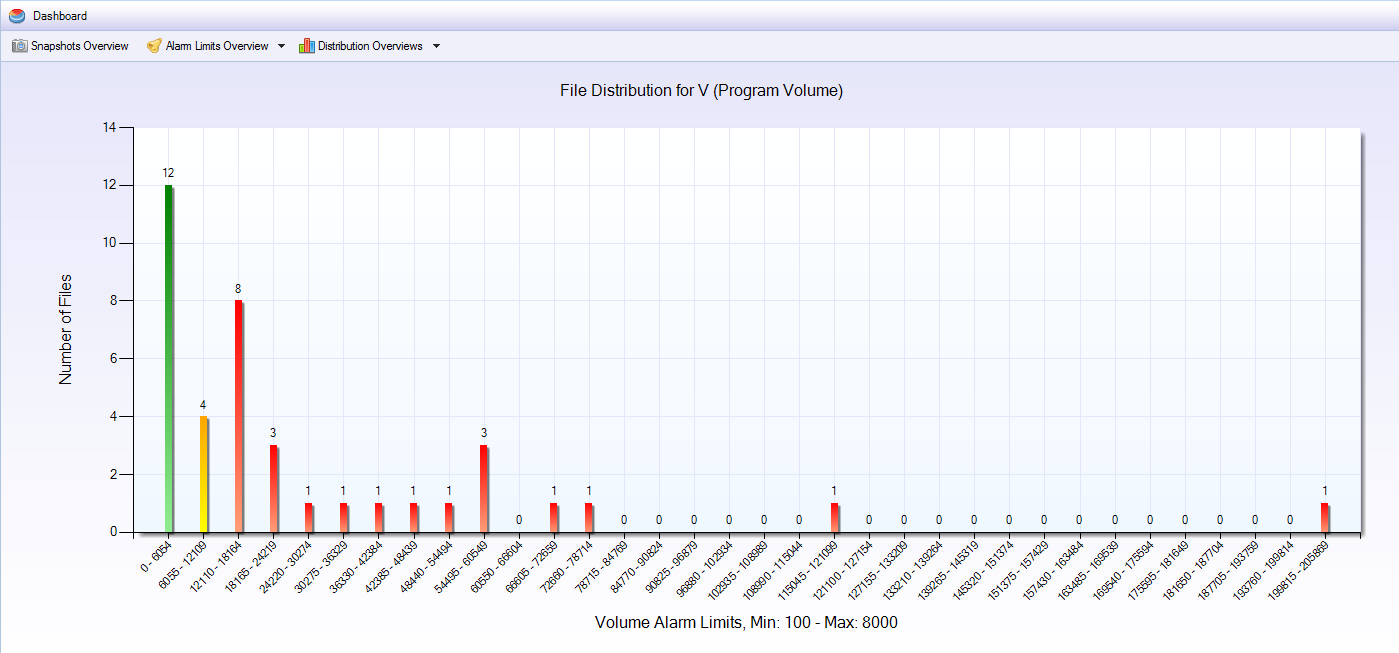
Fig. 4.5.1: Distribution of all measured files to metric V (Program Volume).
Keep in mind that you can always export any diagram to an image format for presentations or other documentations. Right-click any chart and select Save to Image. The following image formats are available:
To begin measuring source files create a new project via the main menu or press Ctrl + N and follow the Project Wizard. After the creation of a project follow the Snapshot Wizard and select all source files you want to be measured in the new snapshot. Verybench will then measure all selected source files fully automatically in all three scopes. After the analysis has finished, you can see all measured metric values within the Metrics View. Switch to that view by clicking Metrics button within the Quick Bar. The Metrics View allows you to zoom in and out from Function Scope metrics to File Scope metrics and vice versa. Be sure to always know what scope you are looking at. However, the System Scope metrics can only be viewed within the Latest Snapshot Overview tab within the Snapshots Overview and has solely statistical meaning. Have a look at your latest snapshots. Switch to Dashboard View by clicking the Dashboard button within the Quick Bar to quickly see how good or bad your code actually is. If you want to see an advice on how to go about improving your source code, take a look at the Code Quality Rating also within the Snapshots Overview.
Now, if you done examining your metrics values, metrics relationship and statistics, you can edit your project setting by right-clicking the main project and selecting Edit Settings…. The Project Editor will show up presenting the settings of the latest snapshot to you with its collection of source files. Make sure to have read all about a specific metric before changing its alarm limits. Changing the alarm limits on one scope does not affect alarm limits in another scope. All scopes are measured fully separately. If you think you messed up your alarm limits feel free to reset it by clicking the respective blue Reset icons next to each numeric box or simply cancel the dialog and start it again. As long as you do not press Save, everything stay the same. After you have done your editing press Save and the snapshot will be remeasured, again presenting all metric results, metrics relationships and statistics after the measurement has finished.
Edit Advanced Settings
You should not edit the Advanced Settings unless you know exactly what you are doing. Be sure to have read the original user guide of Testwell CMT++ 5.0 carefully before you edit these kinds of settings.
Verybench is able of exporting its data to several different file formats including HTML, PDF, Text, CSV and XML. These export formats differ in their settings.
6.1 PDF Reports
To generate a PDF report, use the main menu or click the Reports button within the Quick Bar. The Reports Editor will show up. Select the PDF tab and start customizing your report.
On the cover page can set:
-
A customized title
-
A location to save the report to. If you do not select a specific location, the report will be saved to your project location.
-
A cover image that will be proportionally resized and fit into the right upper corner of the PDF report's cover.
For following pages you can set:
-
If the report title should be displayed
-
If the project title should be displayed
-
If the report's creation date should be displayed
-
If the report's author should be displayed
-
Which side page numbers should be displayed in footer: left, center, right
In general you can set:
-
Which color theme the report should have: black, blue, green, red, gray
-
Your company's address (which is displayed at the bottom of the cover page)
6.2 HTML Reports
To generate an HTML report, use the main menu or click the Reports button within the Quick Bar. The Reports Editor will show up. Select the XML tab and start customizing your report.
For HTML reports you can set:
-
A customized title
-
A location to save the report to. If you do not select a specific location, the report will be saved in your project location.
-
If JavaScript should be enabled or not. This enables the report to have interactive elements to expand or collapse sections of source code.
-
If the source files the report is generated for should be transformed into HTML pages so you can pass them along in HTML form together with the report itself.
6.3 CSV Reports
To generate a CSV report, use the main menu or click the Reports button within the Quick Bar. The Reports Editor will show up. Select the HTML tab and start customizing your report.
For CSV reports you can set:
-
A customized title
-
A location to save the report to. If you do not select a specific location, the report will be saved in your project location.
-
A field separator: Comma, Semicolon, White Space
-
If the columns that are separated by the field separator should carry a title.
6.4 XML Reports
To generate an XML report, use the main menu or click the Reports button within the Quick Bar. The Reports Editor will show up. Select the HTML tab and start customizing your report. For XML reports you can set:
-
A customized title
-
A location to save the report to. If you do not select a specific location, the report will be saved in your project location.
-
If a full long report should be generated.
6.5 Text Reports
To generate a TXT report, use the main menu or click the Reports button within the Quick Bar. The Reports Editor will show up. Select the HTML tab and start customizing your report.
For TXT reports there are no settings.
If you receive an error message after starting Verybench follow the instructions stated and correct the error that has occurred. Contact Verifysoft Technology in case you do not know how to proceed: info@verifysoft.com
7.1 Testwell CMT++ Error Messages
For Testwell CMT++ error messages please refer to Testwell's user guide that is shipped with Testwell CMT++ 5.0.
7.2 Working with FLEXlm License Server
If Testwell CMT++ cannot establish a connection to the FLEXlm license server, it will show the message box shown in figure 7.2.1.
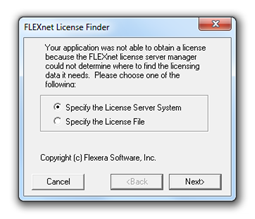
Fig. 7.2.1: FLEXlm error message when no license could be obtained.
Case 1 (typical case):
Your FLEXlm license server is known to Testwell CMT++ because you provided Testwell CMT++ with all necessary information when you installed it.
Solution:
This error occurs because you are working with a bad or no connection to the FLEXlm License Server. Reestablish the connection to FLEXlm and the error is gone, make sure the connection has really been reestablished and keep clicking Cancel until Verybench starts/goes on analysing your source files. Usually, you should not type in anything into this dialog box unless needed (see case 2).
Case 2:
Your FLEXlm license server is not known to Testwell CMT++. Then the error occurs because you are working with an unknown FLEXlm License Server. Follow the dialog and provide Testwell CMT++ will all necessary information. After finishing the dialog Verybench will start/goe on analysing your source files.
In general, if errors originating from Testwell CMT++ cannot not be fixed, the analysis of Verybench will result in a failure causing it to shut down (close) the current main project. This is done for integrity reasons. The project that failed analyse is not altered in any way and can be reopened any time after the failure. Make sure to correct a possible bad connection to FLEXlm prior to analysing another project or reopen the project that failed in the first place.
© Verifysoft Technology GmbH 2013. Verybench and Testwell CMT++ are products of Verifysoft Technology GmbH, Offenburg Germany.