Overview Page
The overview page of the HTML report (index.html) shows the coverage in total and per one or two levels of detail in a tabular view.
- The caption containing the project name defined with
-D "ProjectName=My Home Control AI" - Expandable detail information: Symbol and data files used, command-line, number of instrumented files.
- Total coverage figures for all measures chosen with
-measures
                    mcdc,d,s,f
. - Entities selected for the one or two levels of detail.
- One column per coverage measure.
- Sorting Indicator (descending by missing hits).
- Coverage for one file showing hits, total number of checkpoints, missing hits and the coverage ratio as a bar chart. Missing hits are only displayed if the table is sorted according to this criterion.
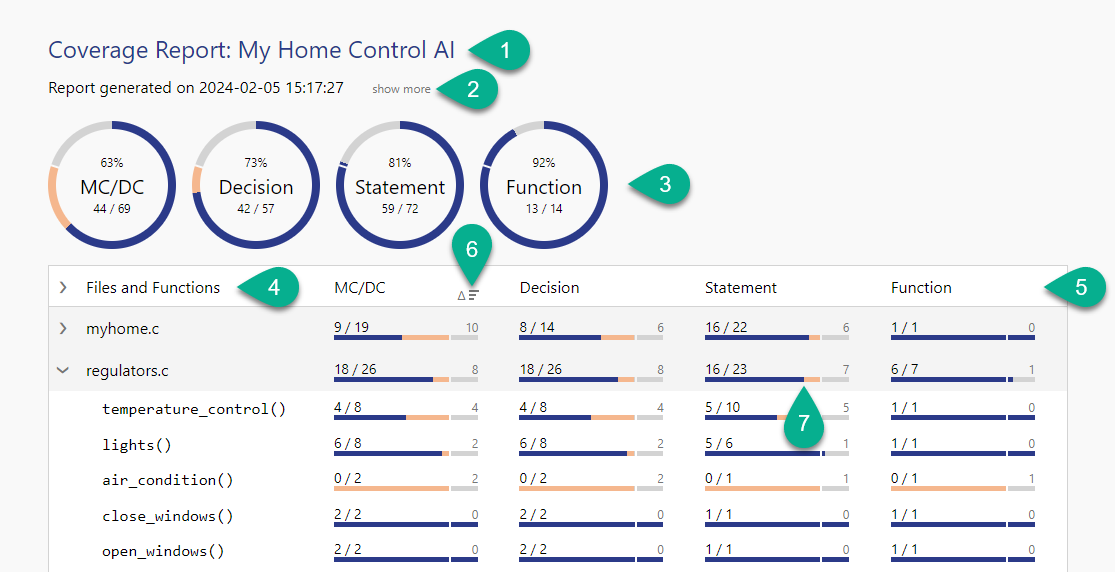
Ring and bar charts visualize coverage data:
- Coverage achieved is shown as blue part.
- Coverage threshold (default 100%) is shown as white indicator.
- Missing coverage up to the threshold is shown in light red.
- When justifications are present, their influence on coverage ratio is shown in a lighter blue.