HTML Report: Execution Profile
The Execution Profile of the HTML report shows the source code per file, annotated with coverage information.
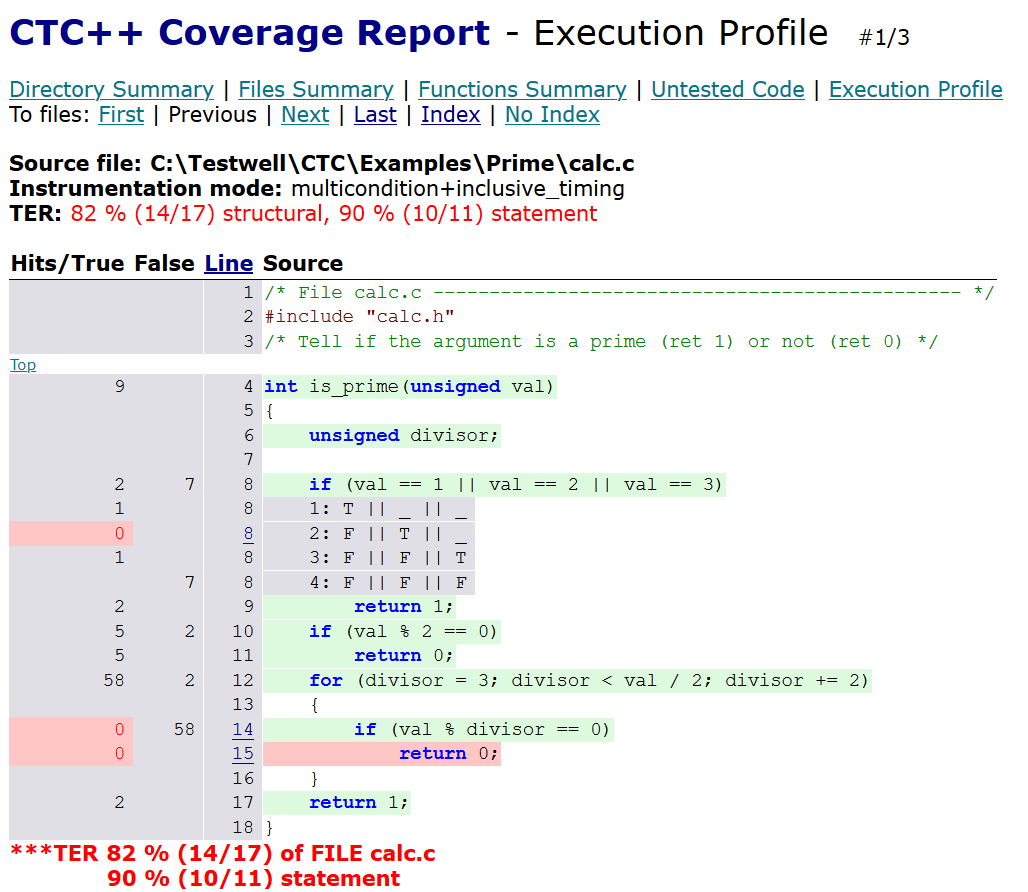
The following information is given in that view:
- On the left hand side of the source code, two columns show hits, TRUE counters and FALSE counters per probe. The number of these locations matches the number of measure points Testwell CTC++ is taking into account, and hence it is equal to the denominator of the structural TER calculation.
- The source code is highlighted with a green or red background, giving a quick visual indication about the executed parts of the code.
- For complex decisions, all TRUE/ FALSE evaluation alternatives are shown under the source code line, with detailed counter information per combination next to it.